AI now sits inside everyday decisions. Most brands can’t see what it’s telling their customers.
Plenty of research counts how many people use AI. We set out to measure its influence: which decisions it shapes, how far people trust it, and what they actually do with its advice.
Reach
How far has AI reached into people’s personal lives?
Influence
Which decisions is it shaping, from what to buy to what to watch?
Trust
Where do people trust it, and where does trust stop?
Action
What should brands do about it?
Wave 1 is the baseline for a quarterly tracker of consumers and of how AI models themselves recommend products.
About the study
Survey conducted conversationally via the Rival Technologies Platform
Collects in-the-moment feedback.
Gets real people to open up and share honest and authentic feedback.
Captures context and emotions to uncover deeper insights.
Remembers previous conversations and continues to learn about your audience.
Reaches all audiences.
Who we talked to
2,081
US adults 18+ surveyed online
83%
have used an AI tool for anything
75%
use AI in their personal lives
66%
have asked AI for advice on something personal
Headline numbers are shares of all US adults, unless otherwise noted. Generations are based on age in 2026: Gen Z 18 to 29, Millennials 30 to 45, Gen X 46 to 61, Boomers+ 62+. The sample is balanced on age and gender only; about half are college graduates, so results may lean toward more-educated consumers.
Online survey of US adults 18+, n=2,081, completed Sept 14, 2026. Balanced to US Census on age and gender. Differences tested at 95% confidence. Source: Banner 1, Table 6 (AI users), Banner 1, Table 9 (personal AI users), Banner 1, Table 44 (advice-seekers)
The short version
Eight things every brand should know
3 in 4
US adults use AI in their personal lives. ChatGPT and Gemini are the go-to for 2 in 3 of them.
54%
of US adults acted on AI’s advice in the last three months. 1 in 5 bought something it recommended.
76%
of people who use AI for advice but say it has little impact on them still acted on its advice. The influence is hidden.
40%
of personal AI users turn to AI for advice on personal decisions. Only 28% turn to social media.
Millennials
lead the shift: 49% turn to AI for decisions vs. 38% to social media. Gen Z is still the most social.
2 to 1
Among people who use both, AI is trusted over social media influencers (34% vs. 19%).
7%
of AI users feel connected to AI and would miss it if it disappeared. This group acts on AI’s advice far more than others.
Voice vs. chat
Voice assistants run the shopping list. Chat AI weighs in on money and life decisions.
Bases vary by measure; see the detailed slides. Source: Banner 1, Tables 9, 11, 26, 28, 40, 41, 42, 45; generation cuts from raw data
Section 1
AI is now part of how people decide
From near-universal awareness to everyday habit, and from search box to trusted advisor
The landscape
AI has gone mainstream: 95% know about it and 3 in 4 use it in their personal lives.
Awareness and use
Have heard of at least one AI tool95%
Have used one83%
Use AI in their personal lives75%
Main AI used for personal life
ChatGPT41%
Google Gemini25%
Siri10%
Alexa+5%
Microsoft Copilot4%
Grok4%
Meta AI3%
Claude3%
Funnel: all adults, n=2,081. Main AI: personal AI users, n=1,570. Top 8 shown; full list in appendix. Source: Banner 1, Table 4 (aware), Banner 1, Table 6 (used), Banner 1, Table 9 (personal use), Banner 1, Table 11 (main AI)
Voice vs. chat AI
Voice assistants run the shopping list. Chat AI weighs in on big decisions.
Voice assistant users primarily use tools like Siri, Alexa, Google Home assistant, while chat AI users primarily use tools like ChatGPT, Claude, etc.
Voice assistant usersvs.Chat AI users
Use AI for shopping or grocery lists
Voice
20%
Chat AI
13%
Tried a recipe, meal or restaurant it suggested
Voice
52%
Chat AI
39%
Bought a product it recommended
Voice
31%
Chat AI
30%
Made a financial decision with it
Voice
9%
Chat AI
20%
Made a relationship or life decision with it
Voice
6%
Chat AI
18%
Turn to AI for personal decisions
Voice
24%
Chat AI
44%
3 in 10
voice and chat AI users alike bought a product that AI recommended. The difference is in what they trust it with.
So what?
For retail and CPG: voice assistants own the kitchen and the shopping list, so be the default answer there. Chat AI likely earns trust on bigger, considered purchases.
Voice assistant users: main personal AI is Siri, Alexa+ or Google Home (n=284; advice-seekers n=226). Chat AI users: all others (n=1,286; n=1,155). Source: Banner 1, Table 28, Banner 1, Table 45, Banner 1, Table 41 (columns S “Voice Primary” vs. T “Not Voice Primary”)
Habit
AI is becoming a daily habit, and use is still climbing
4 in 10
AI users turn to it every day in their personal lives
59%
say their personal use has grown in the past six months. Only 7% say it dropped.
1 in 2
say using AI for everyday things already feels natural
This isn’t trial anymore; it’s a routine forming in real time. Wave 1 is the baseline we’ll track it against.
Daily use and “feels natural”: AI users, n=1,730. Change in use: personal AI users, n=1,570. Source: Banner 1, Table 8 (frequency), Banner 1, Table 27 (change in 6 months), Banner 1, Table 57 (feels natural)
Why people use it
AI isn’t just an answer engine; it’s a trusted advisor.
76% use AI when it’s faster or easier, and 82% of advice-seekers find it helpful.
Biggest benefits people get from AI
Saves me time62%
Makes complex things easier42%
Helps me learn37%
Helps me make better decisions30%
Sparks ideas25%
Helps me feel organized24%
A researcher
60%
use AI to learn or understand something new
A personal shopper
38%
use it for recommendations, and 16% have bought through it
A sounding board
30%
say it helps them make better decisions
“It took away all my overthinking.”
Woman, 34, on planning a trip
Base: personal AI users, n=1,570. Quote: open-ended response. Source: Banner 1, Table 87 (benefits), Banner 1, Table 28 (use cases), Banner 1, Table 53 (faster or easier), Banner 1, Table 46 (helpful), raw data (Q_REFLECTION_TEXT)
Where people turn
AI already beats social media as a source for information.
Even the most social heavy users (Gen Z and Millennials) are turning more to AI for advice and guidance.
Sources of information for advice or guidance
Friends or familyWeb searchAISocial media
Gen Z (18 to 29)
Friends or family
82%
Web search
65%
AI
47%
Social media
41%
Millennials (30 to 45)
Friends or family
74%
Web search
67%
AI
49%
Social media
38%
Gen X (46 to 61)
Friends or family
73%
Web search
75%
AI
36%
Social media
19%
Boomers+ (62+)
Friends or family
73%
Web search
79%
AI
29%
Social media
15%
Paying subscribers go all in
72%
of paying AI subscribers turn to AI for personal decisions, vs. 39% of free users
So what?
AI hasn’t replaced the people we trust, but for younger adults it’s already ahead of the feed. That makes it a channel brands need a plan for.
Personal AI users, n=1,570; multiple answers allowed. Gen Z n=305; Millennials n=466; Gen X n=414; Boomers+ n=385. Subscribers: main AI has a paid tier (n=219). Source: Banner 1, Table 41 (Q_HUMAN_VS_AI; columns U/V for payers), generation cuts from raw data (Q_AGE)
Section 2
Influence is outrunning awareness
People say AI barely affects them. What they do with it says otherwise.
From advice to action
54% of US adults acted on AI’s advice in the last three months
54%
of US adults acted on AI’s advice in the last three months
1 in 5
bought a product recommended by AI
Based on AI’s advice, in the last three months… (% of all US adults)
Tried a recipe, meal or restaurant27%
Followed health or wellness guidance23%
Watched, read, listened to something22%
Bought a product20%
Made a financial decision12%
Took or planned a trip11%
Made a relationship or life decision11%
Subscribed to a new service6%
Asked of people who have sought AI advice (n=1,381), shown as a share of all US adults (n=2,081). Source: Banner 1, Table 45 (Q_ACTIONS_3MO): each count ÷ 2,081 total respondents
The hidden influence
Most say that AI barely affects their decisions. Their actions say otherwise.
The hidden influence
78%
of AI users say it has little or no impact on their day-to-day decisions
76%
of those who say it has little to no impact on their decisions still acted on AI’s advice in the last three months; 27% bought something it recommended
The “I trust myself” paradox
91%
trust own judgment
80%
still acted
91% trust their own judgment more than AI, yet 80% of them acted on its advice.
79% of self-described “cautious” users acted on it too, and 29% bought something through it.
If people don’t notice AI’s role, they won’t mention it in a standard journey or attribution study. Brands are under-measuring it.
Impact: AI users, n=1,730. Actions: advice-seekers who report little or no impact, n=1,007. Paradox: advice-seekers who agree they trust their own judgment more (n=1,250) or are cautious (n=1,168). Source: Banner 1, Table 40 (Q_IMPACT), Banner 1, Table 45 (column G1 “Low Impact”), Banner 1, Table 55 / Banner 1, Table 55 (own judgment, cautious), paradox cuts from raw data
The leading edge
Gen Z and Millennials are bringing AI into bigger decisions
Acted on AI’s advice in the last three months
Gen Z (18 to 29)Millennials (30 to 45)Gen X (46 to 61)Boomers+ (62+)
Made a financial decision
Gen Z
24%
Millennials
22%
Gen X
15%
Boomers+
11%
Made a relationship or life decision
Gen Z
25%
Millennials
21%
Gen X
11%
Boomers+
7%
Started a new hobby or course
Gen Z
19%
Millennials
17%
Gen X
10%
Boomers+
7%
Subscribed to a new service
Gen Z
13%
Millennials
14%
Gen X
6%
Boomers+
3%
So what?
Today’s Gen Z and Millennial behavior is tomorrow’s mainstream. If you sell to younger consumers, assume AI is already part of the decision.
Advice-seekers: Gen Z n=286; Millennials n=422; Gen X n=359; Boomers+ n=314. Source: Banner 1, Table 45 (Q_ACTIONS_3MO), generation cuts from raw data (Q_AGE)
Beyond age
Education and gender shape who AI influences most
Education: an AI divide
High school or lessCollege grad+
Use AI in their personal lives
High school or less
66%
College grad+
80%
Turn to AI for personal decisions
High school or less
30%
College grad+
44%
Say AI has a big impact on decisions
High school or less
16%
College grad+
26%
Bought something AI recommended
High school or less
20%
College grad+
34%
Expect to use AI more
High school or less
38%
College grad+
64%
Gender: men are further along
MenWomen
Heavy (daily+) user of AI for personal matters
Men
45%
Women
37%
Made a financial decision with AI
Men
23%
Women
13%
Say AI has a big impact on decisions
Men
26%
Women
18%
Trust AI over influencers*
Men
44%
Women
24%
Expect to use AI more
Men
63%
Women
49%
Bases vary (all adults, personal AI users, advice-seekers or AI users). *Among those who use both AI and social media (men n=117, women n=125). Significant at 95%. Source: Banner 2, Tables 9, 41, 45, 89, 40, 42 (columns R, T, F, G)
Section 3
The anti-social media age
The feed is losing its monopoly. People are turning from public posts to a private conversation with an AI that knows them.
From feed to conversation
AI is pulling time away from the feed, especially for younger generations
Time with AI usually replaces…
Gen Z (18 to 29)Millennials (30 to 45)Gen X (46 to 61)Boomers+ (62+)
Social media
Gen Z
30%
Millennials
28%
Gen X
25%
Boomers+
18%
TV shows or movies
Gen Z
17%
Millennials
22%
Gen X
19%
Boomers+
14%
Chatting or texting with friends or family
Gen Z
16%
Millennials
14%
Gen X
10%
Boomers+
5%
Gaming
Gen Z
14%
Millennials
12%
Gen X
5%
Boomers+
5%
1 in 4
personal AI users say time with AI replaces time on social media (30% of Gen Z)
“
I use it in place of search engines, or what I used to use Reddit for.
Man, 43
So what?
The public feed is losing time to a private conversation. That takes a different playbook.
AI vs. influencers
Influencers talk to millions. AI talks to you. Where people use both, AI wins on trust nearly 2 to 1.
Which do you trust more for a recommendation?
Trust AI moreAbout equalTrust influencers more
All who use both
34%
47%
19%
Gen Z
30%
36%
34%
Millennials
34%
51%
14%
Men
44%
46%
10%
Women
24%
48%
28%
Daily AI users
42%
41%
17%
Gen Z is the battleground
Gen Z still leans slightly toward influencers (34% vs. 30%). Millennials have switched (34% vs. 14%). Women also lean toward influencers; men favor AI 4 to 1.
So what?
An influencer’s post is the same for everyone who sees it. AI’s answer is built for one person.
That’s a different kind of influence.
Personal AI users who use both AI and social media for advice, n=243 (Gen Z n=77; Millennials n=105; men n=117; women n=125; daily users n=149). Read directionally. Source: Banner 1, Table 42 (Q_TRUST_INFL_VS_AI), Banner 2 Table 42 (gender), generation cuts from raw data (Q_AGE)
Hyper-personal
Trust in AI builds when more context is shared; AI recommends for the person, the mood, and the moment.
What people share with AI when wanting entertainment recommendations
Gen Z (18 to 29)Millennials (30 to 45)Gen X (46 to 61)Boomers+ (62+)
My favorites (the person)
Gen Z
36%
Millennials
29%
Gen X
28%
Boomers+
16%
My mood (the feeling)
Gen Z
25%
Millennials
27%
Gen X
17%
Boomers+
8%
Who I’m with (the moment)
Gen Z
21%
Millennials
17%
Gen X
12%
Boomers+
11%
How much time I have (the moment)
Gen Z
14%
Millennials
15%
Gen X
12%
Boomers+
10%
80%
worry about how much data AI collects. Yet 70% of those worriers trust AI more when it learns their preferences.
13%
of Millennials and 12% of Gen Z feel a real connection with AI, vs. 5% to 6% of older generations.
“I was surprised, pleased and slightly creeped out that it remembered details about my household and who lives there to help make that decision.”
Woman, 46, choosing a robot vacuum
Asked AI to consider: people who ask AI for entertainment advice, n=650 (Gen Z n=157; Millennials n=224; Gen X n=147; Boomers+ n=122). Trust: personal AI users. Connection: AI users. Source: Banner 1, Table 92 (to consider), 58 (data worry). Banner 2, Table 26 (connection). Table 82 paradox cut and quote from raw data
Section 4
Trust and connection
Trust reaches into high-stakes areas, and for some people AI is more than a tool
Trust by category
High trust in AI reaches into nearly all domains of life, including media, shopping, health, finance, even relationships.
Asked AI for advice (% of personal users)Trust its advice (% of those who asked)
Food and recipes
Asked AI for advice
46%
Trust its advice
83%
Health and wellness
Asked AI for advice
44%
Trust its advice
62%
Movies and shows
Asked AI for advice
27%
Trust its advice
79%
Shopping
Asked AI for advice
38%
Trust its advice
70%
Travel
Asked AI for advice
31%
Trust its advice
69%
Tech
Asked AI for advice
29%
Trust its advice
80%
Relationships
Asked AI for advice
22%
Trust its advice
48%
Finances
Asked AI for advice
20%
Trust its advice
60%
55%
of people who asked AI about health followed its advice
“
Doctors often rush so you can’t fully grasp the situation. It really helped me understand.
Woman, 62, on her husband’s health scare
So what?
Usage and trust vary a lot by category. Each one needs its own deep dive.
Asked: personal AI users, n=1,570. Trust: those who asked in each area (n=201 to 721); % who mostly or completely trust. Source: Banner 1, Table 44 (Q_AREAS_ADVICE), Banner 1, Table 60 (Q_TRUST_BY_CAT top-two box); health follow-through (n=690) and quote from raw data
Trust grows with use
Heavier users act on AI’s advice with far more confidence
Confidence acting on AI’s advice without verifying
ExtremelyFairlySomewhatNot confident
Daily users
14%
37%
36%
13%
Weekly users
7%
29%
39%
25%
Monthly or less
2%
16%
36%
45%
Frequency of fact-checking AI advice
AlwaysOftenSometimesRarely or never
Daily users
24%
30%
33%
14%
Weekly users
22%
32%
33%
13%
Monthly or less
37%
23%
19%
21%
18% → 51%
are extremely or fairly confident acting on AI alone, from light to daily users. Light users fact check more often.
So what?
Trust builds with every good experience. At some point, what AI says about your brand becomes the final word.
Meet the ‘AI Attached’: for them, AI is more than a tool
A practical way to get things doneA helpful assistant I’m comfortable chatting withIt understands me, or I feel a real connection
How AI users describe their relationship with AI (All AI Users)
55%
36%
9%
The ‘AI Attached’ are those who say AI understands them or that they feel a real connection with it, AND ALSO would miss AI or really struggle without it, representing 7% of AI users and 6% of all US adults. Gen Z and Millennials make up 71% of this group.
47%
talk to AI about emotions, relationships or life challenges (vs. 18% ‘unattached’)
45%
say their AI has a name, gender or personality (vs. 21% ‘unattached’; about 6 in 10 choose these identities for their AI by themselves or in partnership with AI
88%
say a warm, natural tone makes them trust AI more (vs. 75% ‘unattached’)
Relationship: AI users, n=1,730. Signals: AI Attached AI users, n=121 (name origin: n=33, read directionally). Source: Banner 1, Table 26 (Q_EMO_CONNECTION); AI Attached Banner 3 UNWT: Q_AI_USE_CASES_10, Q_NAMING, Q_AI_NAMING_ORIGIN_1, Q_BUILD_TRUST_7.
The AI Attached
The ‘AI Attached’ act on AI’s advice more than anyone else
The AI AttachedEveryone else
More likely
Confident acting on AI’s advice alone
87%
36%
2.4x
Bought a product AI recommended
50%
28%
1.8x
Made a financial decision with AI
52%
15%
3.5x
Subscribed to a new service suggested by AI
32%
7%
4.6x
Say AI has a big impact on their decisions
78%
18%
4.3x
Each figure is the % of that group. Connection goes with these behaviors; it may not cause them. Advice-seekers: AI Attached n=118, everyone else n=1,263. Big impact: AI users, AI Attached n=121, everyone else n=1,609. Actions = last three months. “More likely” = ratio of the rounded percentages shown. Source: Banner 3; AI Attached vs. Unattached. Measures: Q_CONFIDENCE (Table 47), Q_ACTIONS_3MO (Table 45), Q_IMPACT (Table 40).
In their own words
For some, AI is a confidant, a translator, and a 3 a.m. companion
“
When I was new to grief, I would be up at all hours of the night… the hours that were the worst was not a time to talk to real people. AI really helped me work out my feelings.
Man, 62
“
I recently had upper and lower eyelid surgery. AI guided me through the recovery period, much more thorough than my doctor, and in terms I understood.
Woman, 71
“
I have a personal therapist in my pocket. I can debrief the day, process next steps, and plan for the day or week.
Woman, 29
“
I typed the situation out and asked if I was in the wrong. It gave a surprisingly thorough and patiently human answer that really helped me calm down.
Man, 26, after an argument with his wife
Open-ended responses from AI users, lightly trimmed for length. Attribution shows gender and age only. Source: Raw data, Q_REFLECTION_TEXT
What earns trust
Accuracy, privacy, and proof earn trust
What matters most to trusting AI (pick up to 3)
Useful, accurate information49%
Protecting my privacy35%
Saving me time30%
Being clear where information comes from28%
Showing sources or citations27%
Makes people trust AI more
91%
offering expert or human-verified options
89%
staying consistent over software updates
87%
being clear it’s AI, not a person
Reach3 POV
Accurate, consistent, citable information about your products is now part of how you get recommended.
Trust drivers: AI users, n=1,730. Trust builders: personal AI users, n=1,570. Source: Banner 1, Table 86 (Q_TRUST_DRIVERS), Banner 1, Table 77, Banner 1, Table 85, Banner 1, Table 84 (Q_BUILD_TRUST)
Section 5
What it means by category
Every category at a glance, then a closer look at entertainment, our Wave 1 spotlight. Each wave will spotlight a new category.
Category snapshots
Every category has its own AI story
Food & CPG
46%
Ask AI
83%
Trust it
41% tried a recipe, meal or restaurant
Health
44%
Ask AI
62%
Trust it
55% of those who asked followed its guidance
Retail
38%
Ask AI
70%
Trust it
30% bought a product it recommended
Travel
31%
Ask AI
69%
Trust it
17% took or planned a trip
Tech & Software
29%
Ask AI
80%
Trust it
Tech is one of the most trusted categories for advice
TV & Movies
27%
Ask AI
79%
Trust it
33% watched, read or listened to something
Financial services
20%
Ask AI
60%
Trust it
18% made a financial decision (24% of Gen Z)
Next up
Entertainment is our Wave 1 spotlight. Each wave goes deep on a new category.
Ask AI: personal AI users, n=1,570. Trust: those who asked in each area. Actions: advice-seekers, n=1,381, last three months. Source: Banner 1, Table 44 (asked), Banner 1, Table 60 (trust), Banner 1, Table 45 (actions).
Wave 1 spotlight: Entertainment
AI is a discovery engine and a competitor for screen time
Discovery
41%
of personal users ask AI what to watch, read, play or listen to (76% among AI Attached)
44%
of Millennials, 35% of Gen Z, and 69% of AI Attached are asking it several times per week or daily
Competition for time
25%
say AI time replaces social media (30% of Gen Z, 45% of AI Attached)
18%
say it replaces TV and movies (39% of AI Attached)
22%
of all US adults watched, read or listened to something AI suggested in last 3 months
So what?
Social and social video have been entertainment’s biggest promotion engine. AI is becoming the next one, and it competes for the same screen time. Think recommendation and engagement together, like companion agents for series and franchises.
Personal AI users, n=1,570; entertainment advice users, n=650. The AI Attached = AI users who feel a real connection with AI and would miss it (n=121). Source: Banner 1 and 3, Tables 44, 90, 45, 30.
Wave 1 spotlight: Entertainment
AI sits above every platform’s algorithm and personalizes by generation
What makes AI’s entertainment picks useful
Gen Z (18 to 29)Millennials (30 to 45)Gen X (46 to 61)Boomers+ (62+)
Compares options quickly
Gen Z
48%
Millennials
43%
Gen X
43%
Boomers+
29%
Remembers my preferences
Gen Z
38%
Millennials
37%
Gen X
25%
Boomers+
28%
Understands my tastes
Gen Z
32%
Millennials
37%
Gen X
22%
Boomers+
15%
Tailors picks to my mood
Gen Z
23%
Millennials
33%
Gen X
16%
Boomers+
11%
“It was able to find a book I enjoyed based on the specific parameters I gave.”
Woman, 21
So what?
36% value AI because it recommends across platforms, as it sits above every streaming and retail algorithm.
Know how your titles show up for different people and moods.
People who ask AI for entertainment advice, n=650 (Gen Z n=157; Millennials n=224; Gen X n=147; Boomers+ n=122). Source: Banner 1, Table 93 (Q_MEDIA_REC_QUALITY)
Section 6
What’s next, and what to do about it
AI already has a seat at the table. Here’s how to make sure it’s talking about you.
Looking ahead
Concerns haven’t slowed it down: most people expect to use AI more
55%
of AI users expect to use it more. Only 10% expect to use it less.
41%
would miss AI if it disappeared tomorrow (44%/45% of Gen Z/Millennials)
Why some still hold back
Doubt its accuracy38%
Prefer to do it themselves35%
Worry about privacy30%
Just haven’t thought to17%
News coverage keeps focusing on AI inaccuracy, privacy risks, and the cost of data centers. Even so, more than half of AI users expect to increase their use in the future. Accuracy and privacy are the hurdles that will set the pace.
Future use and “would miss it”: AI users, n=1,730. Barriers: people who don’t use AI in their personal lives, n=511. Source: Banner 1, Table 89 (Q_FUTURE), Banner 1, Table 88 (Q_MISS_IT), Banner 1, Table 10 (Q_AI_PERSONAL_NEVER), generation cuts from raw data (Q_AGE)
What brands should do
Six moves for brands
1
Treat AI as a channel
What we found
40% of personal AI users turn to AI for advice, and where people use both, AI is trusted nearly 2 to 1 over social media influencers.
What to do
Find out how leading AI models describe and rank your brand, products and content against competitors.
Reach3 POV
Reach3: AI Listening
2
Measure what’s hidden
What we found
76% of people ask AI for advice but also say it has little to no impact on them still acted on that advice in the last three months.
What to do
Add AI touchpoints to journey, attribution and brand tracking. Ask about actions, not perceived influence.
Reach3: Custom research & tracking
3
Know your category
What we found
Trust ranges from 83% for food to 48% for relationships, and usage varies just as much.
What to do
Learn how your category’s shoppers use AI, when they trust it and when they double-check.
Reach3: Category deep dives
4
Plan for people, moods, and moments
What we found
74% trust AI more when it learns their preferences. About 1 in 4 Gen Z and Millennial entertainment seekers ask it to match their mood.
What to do
Test how AI recommends you to different personas, moods and occasions.
Reach3 POV
Reach3: AI Listening personas
5
Feed AI the facts
What we found
Accuracy is the #1 trust driver (49%), and 91% trust AI more when it offers expert or verified options.
What to do
Make product information, claims and reviews accurate, consistent and easy for AI to cite.
Reach3 POV
Reach3: AI Listening source analysis
6
Watch the leading edge
What we found
Gen Z and Millennials act on AI far more, like 22 to 24% making financial decisions with it vs. 11% of Boomers+.
What to do
Track these groups every quarter as an early signal of where the mainstream is going.
Reach3: Quarterly AI tracker
Findings are drawn from earlier slides; see those slides for bases. Source: Banner 1, Table 41, Banner 1, Table 42, Banner 1, Table 40, Banner 1, Table 45, Banner 1, Table 44, Banner 1, Table 60; Banner 1, Table 82, Banner 1, Table 92, Banner 1, Table 86, Banner 1, Table 77, generation cuts from raw data (Q_AGE)
What we’re watching next wave
Next up: AI that acts for you
22%
of AI users already have AI sending them automatic updates. That rises to 35% of daily users.
What people want next: an agent, not a chatbot
“
Automatically manage my household budget by tracking bills, comparing grocery prices, and alerting me to sales before I shop each week.
Man, 45
“
Proactively helps me complete them, from planning and research to reminders and follow-ups, while still keeping me in control.
Man, 28
Also on our radar for Wave 2
AI agents
How many people let AI act and buy on their behalf
Gen Z and influencers
Whether Gen Z follows Millennials from the feed to AI
The AI Attached
Whether this group grows, and how its spending shifts
Voice vs. chat
Whether voice assistants catch up on bigger decisions
Automatic updates: AI users, n=1,730 (daily users n=708). Quotes: open-ended responses to “If AI could do one practical new thing for you…” Source: Banner 1, Table 25 (Q_AI_TOOL_FEEDS; column G for daily users), raw data (Q_IDEAL_NEXT)
How Reach3 can help
See your brand the way AI sees it
AI Listening
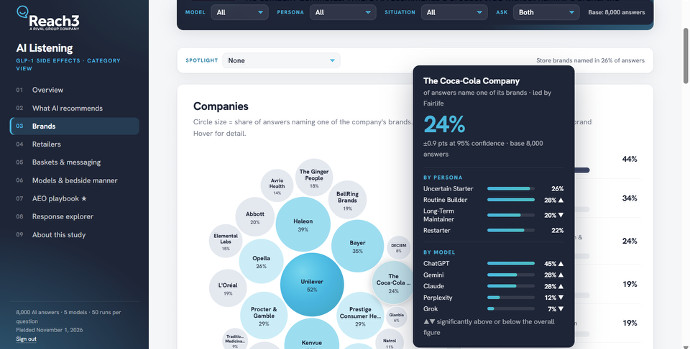
We talk to AI models at scale to see how they recommend, what sources they draw on, how they describe your brand and how answers change for different people and moments.
Moves 1, 4, 5
Category deep dives
How consumers in your category use AI, where they trust it, where they check, and where it enters the path to purchase.
Moves 2, 3
Quarterly AI tracker
Follow consumers and the AI models themselves wave after wave, so you see shifts as they happen.
Move 6
AI Listening in action
AI is starting to upend how consumers decide.
AI learns about each user
Over time, models build an understanding of who someone is, what they need and what they prefer, and bring it into every answer.
Recommendations are hyper-personalized
Two people asking the same question can get different answers, tailored to who the AI believes they are.
The shortlist forms in the conversation
Consumers go from question to a confident recommendation in one step, often before they reach a brand or a store.
Same question
“What’s a good moisturizer for winter?”
What AI knows: 28, runs outdoors, sensitive skin
A light, fragrance-free gel with SPF
What AI knows: 64, retired, very dry skin
A rich cream with ceramides for overnight repair
Different answers
AI Listening in action
For brands, AI is a black box…
No single answer to win
Visibility shifts with who is asking and their situation. A ranking report can’t capture it.
The reasoning is hidden
Brands can’t see why a model chose a competitor, or which criteria it weighed.
Training data can be out of date
When models answer from memory, they may repeat old claims, products or prices.
Sources sit outside brands’ control
When models search, they lean on publishers, retailers and forums, not just brand sites.
AEO
Answer engine optimization (AEO) is the new SEO. But brands can’t optimize what they can’t see: first they need to know what AI recommends, to whom, and why.
AI Listening in action
…until now: We turn the box into a playbook.
Know where you stand
Your share of AI recommendations against competitors, by audience, situation and model.
Understand why
The reasoning, criteria and sources behind each recommendation, and where outdated training data works against you.
Know what to change
The messages, product information and placements that make your brand easier for AI to recommend.
Prioritize and track
Focus on the models and audiences with the most impact, then rerun to measure progress.
The AEO Playbook: Stop guessing what AI says about your brand. Start shaping it.
Heard of: all adults, n=2,081. Used: aware of any AI, n=1,982. Main personal AI: personal AI users, n=1,570. Source: Banner 1, Table 4, Banner 1, Table 5, Banner 1, Table 11
Method and definitions
Method and definitions
Method
Online survey of US adults 18+, n=2,081, completed September 14, 2026. Balanced on age and gender only (51% college grads). Tested at 95%.
AI users (n=1,730)
Have used at least one AI tool for any purpose. 83% of US adults.
Personal AI users (n=1,570)
Use AI outside work or school. 75% of US adults.
Advice-seekers (n=1,381)
Personal AI users who have asked AI for advice in at least one area of life. 66% of US adults.
The AI Attached (n=121)
AI users who say “AI really understands me” or “I feel a real connection with AI” AND would miss AI or really struggle without it. 7% of AI users, about 6% of US adults.
Generations
Based on age in 2026: Gen Z 18 to 29 (n=396), Millennials 30 to 45 (n=578), Gen X 46 to 61 (n=528), Boomers+ 62+ (n=579).
Voice vs. chat AI
Voice assistant users: main personal AI is Siri, Alexa+ or Google Home (n=284). Chat AI users: all other main AIs (n=1,286).
Usage
Daily = personal use at least once a day. Weekly = a few times a week to once a week. Monthly or less = a few times a month or less.
Get in touch with us to discover what AI says about your brand.










The anti-social media age
The feed is losing its monopoly. People are turning from public posts to a private conversation with an AI that knows them.
AI is pulling time away from the feed, especially for younger generations
Influencers talk to millions. AI talks to you. Where people use both, AI wins on trust nearly 2 to 1.
That’s a different kind of influence.
Personal AI users who use both AI and social media for advice, n=243 (Gen Z n=77; Millennials n=105; men n=117; women n=125; daily users n=149). Read directionally.
Source: Banner 1, Table 42 (Q_TRUST_INFL_VS_AI), Banner 2 Table 42 (gender), generation cuts from raw data (Q_AGE)
Trust in AI builds when more context is shared; AI recommends for the person, the mood, and the moment.
Asked AI to consider: people who ask AI for entertainment advice, n=650 (Gen Z n=157; Millennials n=224; Gen X n=147; Boomers+ n=122). Trust: personal AI users. Connection: AI users.
Source: Banner 1, Table 92 (to consider), 58 (data worry). Banner 2, Table 26 (connection). Table 82 paradox cut and quote from raw data